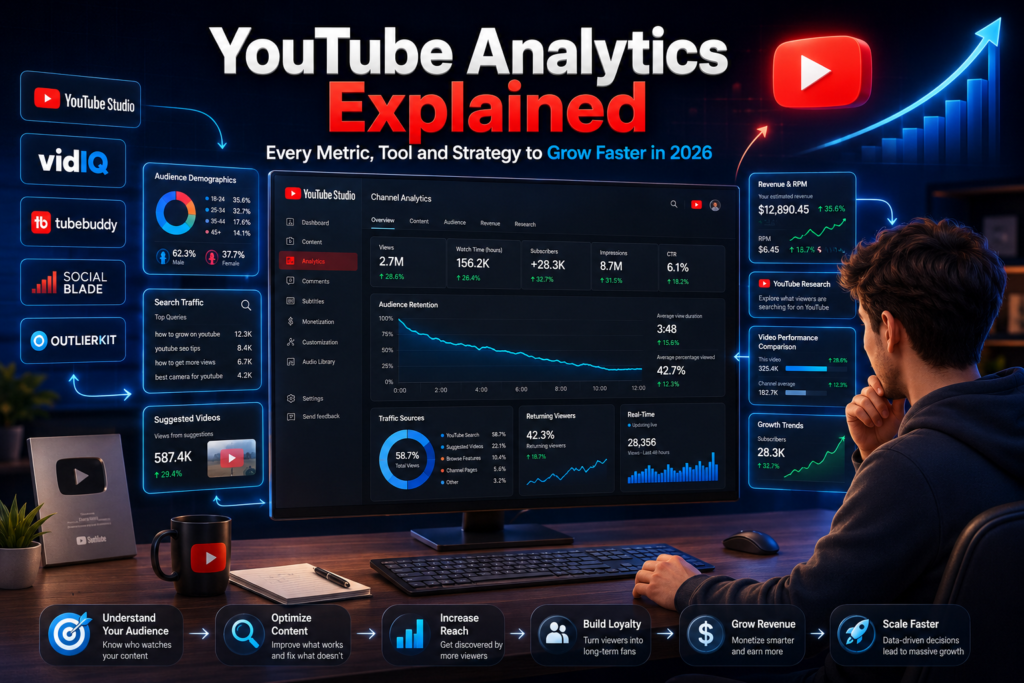
YouTube Analytics Explained – Every Metric, Tool and Strategy to Grow in 2026
Posted on June 22, 2026 by Jason Caldwell
YouTube Analytics is the single most important tool available to any creator who wants to grow — yet most creators either ignore it entirely or check only views and subscribers, leaving the most valuable data completely untouched. Channels that consistently grow are not the ones that post the most or the longest. They’re the ones that understand exactly what their audience is doing, when they stop watching, where they came from, and what made them subscribe — and then use that information to make the next video better than the last.
This guide covers every layer of YouTube Analytics in 2026: how to navigate YouTube Studio, how to read channel and video-level data, how to interpret the audience retention graph, which third-party tools are worth using, the most common mistakes creators make with their data, and a practical framework for turning analytics into better content decisions every single week.
Whether you’re a brand new creator trying to understand your dashboard for the first time or an established channel looking to break through a growth plateau, this is everything you need to know.
What Is YouTube Analytics?
YouTube Analytics is YouTube’s built-in data reporting system, accessible through YouTube Studio, that tracks and displays performance data for your channel and every individual video you upload. It records how many people watched your content, how long they watched, where they came from, who they are, and what actions they took after watching — including subscribing, clicking end screens, or moving to another video.
The data YouTube Analytics provides is first-party — meaning it comes directly from YouTube’s own systems, not a third-party estimate. Every metric in your dashboard reflects actual viewer behaviour on your channel, which makes it more accurate and more actionable than any external tracking tool can provide on its own.
YouTube Analytics is free for every channel with a YouTube account, and it updates continuously throughout the day.
How to Navigate YouTube Studio Analytics in 2026
YouTube Studio is the control centre for everything related to your channel — publishing, comments, monetisation, and most importantly, analytics. Here is a complete walkthrough of every section.
Accessing Your Analytics Dashboard:
- Go to studio.youtube.com and log into your YouTube account.
- In the left-hand sidebar, click Analytics.
- You’ll land on the Overview tab, which gives a high-level summary of your channel’s recent performance.
- Use the date range selector (top right of the dashboard) to adjust the period you’re analysing — options include 7 days, 28 days, 90 days, 365 days, and custom ranges.
- Switch between tabs — Overview, Content, Audience, Revenue, and Research — depending on what you want to examine.
The Overview Tab
The Overview tab gives you a snapshot of four core metrics for your selected date range: Views, Watch Time (hours), Subscribers gained, and Estimated Revenue (if your channel is monetised). Below this summary you’ll find a graph showing daily performance across whichever metric you select, and a “Top content” section listing your best-performing videos for that period.
This tab is useful for spotting trends at a glance — a sudden spike in views, an unexpected subscriber loss, or a week where watch time dropped despite view count staying flat. Each of these patterns points to a specific issue or opportunity worth investigating in the other tabs.
The Content Tab
The Content tab breaks down performance by individual video, Shorts, and live streams. For each piece of content you can see impressions, click-through rate (CTR), views, average view duration, and watch time. This is where you identify which videos are driving your channel’s growth and which are underperforming relative to their impressions.
Sort the content list by different metrics to find patterns: which videos have your highest CTR? Which have the longest average view duration? Often these two lists contain different videos — and understanding why reveals the gap between what gets people to click and what keeps them watching.
The Audience Tab
The Audience tab shows you who your viewers are and when they’re active. Key data here includes:
– Returning vs new viewers — what percentage of your recent views came from people who had watched before
– Unique viewers — total individual accounts who watched, separate from total view count
– Subscriber count and net change over time
– Age and gender breakdown of your audience
– Top geographies by views and watch time
– When your viewers are on YouTube — a heat map showing peak activity hours by day of the week, useful for scheduling uploads
The Revenue Tab
Available only to monetised channels in the YouTube Partner Program. Shows estimated revenue, RPM (revenue per thousand views), CPM (what advertisers paid), monetised playbacks, and a breakdown by video. Use this tab to identify which content earns most per view — often educational and finance content has significantly higher RPM than entertainment, which informs content strategy decisions beyond just viewership.
The Research Tab
The Research tab (also called Search Insights in some regions) shows you what your viewers and the broader YouTube audience are searching for within your content category. It highlights search terms your existing viewers use and — most valuably — “content gaps”: topics with high search volume that your channel hasn’t covered yet. This is one of the most underused tabs in YouTube Studio and one of the most directly useful for content planning.
YouTube Channel Analytics — Understanding Your Overall Channel Performance
YouTube channel analytics refers to performance data at the whole-channel level rather than for individual videos. Understanding the distinction matters because channel-level trends tell you different things than video-level data.
Channel Views vs Video Views
Total channel views aggregate every view across all your uploads within a period. This number can be misleading if most of your views are concentrated in one or two older videos — your channel may show strong overall numbers while your recent content is underperforming. Always compare channel-level data against video-level data before drawing conclusions about growth.
Total Watch Time
Watch time is YouTube’s most important ranking signal. A channel accumulating thousands of hours of watch time signals to YouTube’s algorithm that its content holds viewers’ attention — which directly influences how aggressively YouTube recommends that content to new audiences. Monitor your total watch time trend month over month rather than week over week to identify genuine directional changes versus normal fluctuation.
Subscriber Growth Patterns
Your subscriber count in isolation is a vanity metric. What matters is the pattern: which specific videos drove the most subscriber conversions? Is your subscriber growth accelerating, plateauing, or declining? Are you gaining subscribers but also losing significant numbers at the same time (net subscribers can hide a high churn rate)? YouTube Analytics shows both subscribers gained and subscribers lost, which gives you a much clearer picture of your channel’s actual health.
Audience Demographics and Content Planning
Your audience demographics — age, gender, geography — should actively inform what you produce. A channel that discovers 70% of its audience is aged 25–34 and based in two countries now has specific information about cultural references, language register, posting time zones, and topic relevance. Demographics are not just descriptive data; they’re a content brief.
YouTube Video Analytics — The 7 Numbers That Actually Matter Per Video
While channel analytics tells you where your channel is heading, video analytics tells you why. These are the seven metrics that matter most for evaluating any individual upload.
- Impressions
Impressions count how many times YouTube showed your video’s thumbnail to a logged-in user on the platform — on the home page, in search results, in suggested videos, or in subscriptions. A low impression count relative to your subscriber base suggests YouTube is not distributing your video widely, which can indicate a weak title or thumbnail, topic mismatch with recent content, or suppression from low engagement on previous uploads.
- Click-Through Rate (CTR)
CTR measures the percentage of impressions that resulted in a click. YouTube’s own data suggests the average CTR across the platform sits between 2% and 10%, with most established channels landing between 4% and 6%. A CTR below 2% almost always indicates a thumbnail or title problem. A very high CTR (above 10%) with poor retention often means the thumbnail or title overpromised what the video delivered.
- Average View Duration and Average Percentage Viewed
Average view duration is the mean length of time viewers spent watching your video. Average percentage viewed expresses that as a proportion of the video’s total length. For short-form content these numbers should be high; for long-form content (10+ minutes), maintaining above 40–50% average view percentage is strong performance. Anything below 30% on long-form content typically indicates pacing, structure, or relevance problems in the video itself.
- Audience Retention Graph
Covered in its own section below — this is the most detailed and actionable data point per video.
- Traffic Source Breakdown Per Video
Where did this specific video’s viewers come from? A video that gets most of its traffic from YouTube Search is performing differently in the algorithm than one driven by Suggested Videos. Search traffic indicates keyword relevance; Suggested Video traffic indicates strong engagement signals that caused YouTube to recommend the video alongside other popular content. Understanding the traffic source helps you replicate the conditions that caused a video to perform well.
- Subscriber Conversion Per Video
Under the Audience tab within an individual video’s analytics, YouTube shows how many subscribers that specific video generated. A video with 50,000 views but zero subscriber conversions attracted casual viewers who didn’t find the channel worth following. A video with 5,000 views and 400 subscriber conversions built your audience more effectively. The latter type of video is worth making more of.
- Impressions-to-Watch-Time Funnel
Taken together, impressions → CTR → average view duration → subscriber conversion forms a funnel that shows the full journey from YouTube distributing your video to a viewer becoming a subscriber. A weakness at any point in this funnel is identifiable and fixable with specific interventions — thumbnail redesign, title rewrite, stronger opening, better video structure, or clearer call to action.
How to Read the Audience Retention Graph in YouTube Analytics
The audience retention graph is the most detailed data YouTube provides about how viewers experienced a specific video, and it is consistently the most underused analytical tool in YouTube Studio.
What the Graph Shows
The retention graph plots the percentage of viewers still watching at each second of your video. It starts at 100% at the 0:00 mark and trends downward across the video’s runtime. The shape of this curve tells you more about what’s actually happening inside your video than any other single metric.
What the Curve Shape Means
A gradual, steady decline is healthy and expected — some drop-off at every stage is normal. What to look for is the anomalies: sudden steep drops (viewers leaving in large numbers at a specific moment), plateaus (sections where retention stabilises and viewers stay engaged), and spikes (moments viewers rewound to rewatch — a strong positive signal).
Why the First 30 Seconds Matter Most
The steepest drop in most videos occurs in the first 30 seconds. This is where viewers decide whether to keep watching or exit. A video that retains 70%+ of viewers through the first 30 seconds has a strong hook. A video that loses 40% of viewers before the 30-second mark almost always has a slow opening — too much intro, too much preamble, or a failure to immediately deliver on the promise made by the title and thumbnail.
How to Identify Problem Timestamps
Click on any point of steep decline in the retention graph to jump to that exact timestamp in your video. Watch what’s happening at that moment — is it a section that runs too long, an off-topic tangent, a sudden drop in production quality, or a moment where the pacing stalls? Each of these is a specific, fixable problem in the next video covering similar content.
What a Healthy Retention Curve Looks Like
A healthy retention curve for a 10-minute video retains roughly 60–70% of viewers at the 2-minute mark, 40–50% at the halfway point, and 25–35% at the end. Maintaining above 50% at the midpoint is strong for most niches. Retention curves that are consistently above these benchmarks indicate a creator who has mastered their content structure and audience expectations.
How to Use Retention Data to Improve Future Videos
Identify your top 3 performing videos by average view duration and watch the sections that appear as retention plateaus — those are your best content moments. What do they have in common? Usually: a specific story structure, a visual format, a pacing rhythm, or a delivery style that keeps the audience engaged. Build more of your videos around those patterns.
How to Use YouTube Real-Time Analytics
YouTube’s real-time analytics panel — accessible at the top of your Analytics Overview — shows view activity from the last 48 hours and the last 60 minutes, updated continuously.
What Real-Time Data Shows
Real-time analytics displays how many views your channel is receiving right now, which specific videos are driving those views, and the traffic sources generating that activity. It’s particularly useful in the hours immediately after publishing a new video.
The 48-Hour Window — Why It Matters for Algorithm Momentum
The first 48 hours after a video is published is YouTube’s primary evaluation window. During this period, YouTube distributes your video to a test audience — typically your existing subscribers and viewers who match your typical audience profile — and measures their response: click-through rate, watch time, and engagement signals like likes and comments. If those signals are strong, YouTube expands distribution. If they’re weak, the video is deprioritised in recommendations.
Monitoring real-time analytics in this window tells you whether your video is getting initial traction. A video that shows strong hourly view counts in the first few hours after publishing is generating positive signals. A video that flatlines immediately is not getting initial distribution — either because the thumbnail is not being clicked, or because YouTube is not serving it widely yet, possibly due to low recent engagement on the channel.
Best Time to Post Based on Your Audience Data
Your Audience tab shows a “When your viewers are on YouTube” heat map. The peak activity period shown there is your target publish window — uploading 1–2 hours before your audience’s peak activity time gives the video time to be indexed and distributed before your viewers are most active on the platform.
Best YouTube Analytics Tools in 2026 — Free and Paid Compared
YouTube Studio provides the most accurate first-party data available. But third-party tools layer additional research, competitor tracking, and workflow features on top of that foundation. Here is an honest comparison of the tools worth considering.
YouTube Studio (Free — The Baseline)
Every metric described in this guide is available natively in YouTube Studio at no cost. For most creators at any stage, YouTube Studio alone provides more data than they are currently using. Before investing in any paid tool, make sure you have fully explored what Studio already gives you.
VidIQ
VidIQ’s primary strengths are keyword research, video scoring (a composite metric that estimates a video’s chance of ranking), and competitor channel tracking. Its daily idea feature suggests video topics based on trending searches in your niche. Pricing starts at a free tier with limited features, moving to Basic ($7.50/month), Boost ($39/month), and Max ($79/month) plans. Best for: creators focused on SEO-driven content who want structured keyword guidance.
TubeBuddy
TubeBuddy operates as a browser extension that overlays data directly onto YouTube’s interface. Its most useful features include A/B thumbnail testing (Pro tier and above), bulk video editing tools, best time to publish recommendations, and SEO keyword explorer. Pricing: free tier available; Pro at $4.99/month, Legend at $19.99/month. Best for: established creators managing a large video library who need workflow and optimisation tools alongside analytics.
Social Blade
Social Blade specialises in competitor tracking — you can search any public YouTube channel and see its historical subscriber and view growth charted over time. It also provides grade ratings and growth projections. Pricing: free for basic tracking; Plus plans from $3.99/month for detailed historical data. Best for: creators who want context on how their growth compares to similar channels in their niche.
TubeAnalytics
TubeAnalytics provides revenue estimation data and RPM benchmarking by niche — useful for monetised creators trying to understand how their earnings compare to industry standards and for identifying higher-revenue content categories worth producing. Pricing varies; basic access is free.
OutlierKit
OutlierKit identifies “outlier” videos in any niche — content that dramatically outperformed the channel’s average view count — and surfaces the title patterns, thumbnail styles, and topic angles that produced those results. It is particularly useful for thumbnail and title research. Pricing starts at approximately $17/month. Best for: creators who want data on what’s actually working in their niche before deciding what to film.
How to Choose the Right Tool
If you are under 10,000 subscribers: YouTube Studio is sufficient. Learn it completely before spending money on third-party tools. If you are 10,000–100,000 subscribers and focused on SEO growth: VidIQ or TubeBuddy (not both — they overlap significantly). If you are monetised and want competitive intelligence: add Social Blade for competitor tracking and TubeAnalytics for revenue benchmarking. If you want thumbnail and title research for any existing channel size: OutlierKit provides a specific and useful data layer that the others don’t replicate.
A note on Vedzzy and traffic source tracking: for creators running Google Ads-based YouTube promotion campaigns, the Traffic Sources section of YouTube Analytics becomes particularly valuable. All views generated through legitimate promotion platforms like Vedzzy appear under “YouTube advertising” as a clearly labelled traffic source — with full watch time, demographic, and retention data attached. This means you can verify exactly what your promotion campaign delivered directly inside YouTube Studio, without relying on any third-party reporting. If a promotion service cannot show up in your Traffic Sources tab as YouTube advertising, the views it claims to deliver are not coming through YouTube’s legitimate ad infrastructure.
Common YouTube Analytics Mistakes Creators Make (And How to Fix Them)
Understanding analytics data is only useful if you’re reading it correctly. These are the six most common mistakes creators make with their YouTube Analytics.
- Checking Analytics Every Day
Daily analytics checking creates anxiety without insight. Day-to-day fluctuation in views and watch time is normal and largely meaningless — it reflects weekend/weekday patterns, upload timing, and random algorithm variation. Check your analytics weekly for trend data and monthly for strategic review. Daily checks are almost never actionable.
- Only Looking at Views
Views are the most visible metric and the least informative on its own. A video with 100,000 views and 15% average view duration performed worse than a video with 10,000 views and 65% average view duration — because the latter sent far stronger signals to YouTube’s algorithm. Always read views alongside CTR, average view duration, and watch time.
- Ignoring the First 30 Seconds of the Retention Graph
Most creators look at their overall retention percentage and stop there. The first 30 seconds of the retention graph is where the most actionable data lives — a steep early drop tells you specifically that your hook is failing, which is the highest-impact single fix available for a struggling video format.
- Not Checking Traffic Sources
Traffic source data tells you whether YouTube is distributing your video organically or whether viewers are finding it primarily through your own promotion. A video getting 90% of its traffic from direct links and external sources has not been picked up by the algorithm — it’s surviving on manual sharing alone, which doesn’t scale. Understanding traffic source breakdown helps you distinguish between algorithm-driven growth and audience-driven reach.
- Not Comparing Videos to Find Patterns
Individual video performance is interesting but not strategic. The strategic value in analytics comes from comparing your top 10 videos to your bottom 10 — across CTR, retention, subscriber conversion, and traffic source — and finding what the high performers have in common. Those commonalities are your growth blueprint.
- Confusing Unique Viewers With Total Views
Total views count every playback, including the same person watching multiple times. Unique viewers count individual accounts. A video with 50,000 views but only 8,000 unique viewers was mostly watched repeatedly by a small group of dedicated fans — it did not reach a wide audience. A video with 50,000 views and 47,000 unique viewers reached a broad, new audience. The second scenario is far more valuable for channel growth.
How to Use YouTube Analytics to Make Better Content Decisions
Analytics data is only valuable when it changes what you do next. Here is a practical framework for turning your data into content decisions every week and every month.
Weekly Analytics Review (20 Minutes)
Every week, check these four things:
- View count and watch time trend for the past 7 days compared to the previous 7 days — is the channel trending up or down?
- CTR and average view duration for your most recent video — did it meet your personal benchmarks?
- Traffic source breakdown for recent videos — is YouTube distributing your content, or is it relying on direct shares?
- Subscriber net change — are you gaining more than you’re losing?
This 20-minute weekly check gives you enough to know whether your recent content is working and whether any immediate adjustments are needed before your next upload.
Monthly Deep Dive (60 Minutes)
Once a month, set aside an hour for a deeper review:
- Pull your last 30 days of analytics and sort your videos by average view duration — not views. Which videos kept people watching longest?
- Check your Audience tab for demographic changes — is your audience shifting in age, geography, or gender? Does that match the audience you’re trying to build?
- Open the Research tab and look for content gaps — topics your audience is searching for that you haven’t covered yet.
- Review your subscriber conversion rate per video — which videos are turning viewers into subscribers and which aren’t?
How to Identify Your Best Performing Content Pattern
After 20 or more uploads, sort your full video library by watch time (not views). Look at the top 5. What do they have in common? Topic category? Video length? Thumbnail style? Title format? Opening structure? The answer to that question is your strongest content pattern — the formula your specific audience responds to best. Make more of those videos.
How to Plan Your Next 4 Videos Using Analytics
Using the combination of your Research tab (what people are searching for), your top-performing content pattern (what your audience watches longest), and your traffic source data (what topics YouTube is distributing most widely), you can build a data-backed content calendar that is grounded in evidence rather than guesswork. One video from a content gap in the Research tab. One video replicating your highest-retention format. One video targeting a secondary keyword your top traffic source video didn’t fully cover. One video experimenting with a new format for data you don’t yet have.
When to Update vs Delete an Underperforming Video
Not every old video is worth deleting — some continue accumulating search traffic quietly even with low overall numbers. Before deleting, check: is it still receiving consistent views from YouTube Search? If yes, update the title, description, and thumbnail rather than deleting — refreshed metadata can revive search traffic without losing the watch time history already accumulated. Delete only if the video is receiving near-zero traffic from all sources and has a retention rate below 20%, as at that point it is providing no value and may be mildly suppressing channel-wide performance signals.
Frequently Asked Questions
What is YouTube Analytics?
YouTube Analytics is YouTube’s built-in data reporting system available through YouTube Studio. It tracks views, watch time, audience demographics, traffic sources, subscriber changes, and video performance metrics for your channel and every individual video you publish. It is free for all YouTube accounts.
How do I access YouTube Analytics?
Log into your YouTube account, go to studio.youtube.com, and click “Analytics” in the left-hand sidebar. From there you can view channel-level data across the Overview, Content, Audience, Revenue, and Research tabs.
What is a good CTR on YouTube?
YouTube’s platform average CTR is between 2% and 10%, with most established channels averaging 4–6%. A CTR below 2% typically indicates a thumbnail or title that is not compelling enough. A CTR above 8% is strong and suggests the title and thumbnail are generating significant curiosity clicks.
What is a good watch time percentage?
For videos over 10 minutes, retaining 40–50% of viewers on average is considered strong. For videos under 5 minutes, 60–70%+ is a reasonable benchmark. These numbers vary significantly by niche — educational and tutorial content tends to have higher retention than entertainment or vlog-style content.
How often should I check YouTube Analytics?
Weekly for trend monitoring, monthly for strategic review. Daily checking creates noise rather than signal and leads to reactive decisions based on normal fluctuation rather than genuine trends.
What does average view duration mean?
Average view duration is the mean length of time viewers spent watching a specific video before leaving. It is one of YouTube’s primary signals for video quality — longer average view durations indicate that the content held viewers’ attention, which YouTube rewards with broader distribution.
What is the difference between views and impressions?
Impressions count how many times YouTube showed your thumbnail to a logged-in user. Views count how many times someone actually clicked through and watched at least a few seconds. The ratio between them is your CTR. You can have millions of impressions and low views if your thumbnail and title are not convincing people to click.
What is audience retention on YouTube?
Audience retention measures the percentage of your video that viewers watch on average, and the audience retention graph shows viewer drop-off at every individual second of your video. It is the most detailed per-video performance data YouTube provides and the most directly actionable for improving content quality.
Which YouTube analytics tool is best for beginners?
YouTube Studio itself. It is free, accurate, and contains more data than most creators fully utilise. Once you have mastered Studio and are publishing consistently, VidIQ or TubeBuddy add useful keyword research and optimisation layers on top.
How do I know if my YouTube channel is growing?
Look at three metrics together over a 90-day trend: watch time (increasing), subscriber net gain (positive and growing), and CTR on recent videos (stable or improving). A channel that is growing will show upward movement in at least two of these three over a 90-day window. View count alone is not a reliable growth indicator.
Related Reading on Vedzzy
If you found this guide useful, our breakdown of How to Optimize Your YouTube Channel in 2026 covers the non-analytics side of channel growth — profile setup, channel keywords, and the structural elements that affect how YouTube categorises and recommends your content. For creators thinking about accelerating early growth through promotion, our guide to How Our Targeted YouTube Promotion Services Drive Fast and Sustainable Growth explains how Google Ads-based promotion works alongside organic analytics data to build genuine channel momentum.

Hi, I am Jason, a digital content strategist with 8 years of experience helping YouTube creators and brands grow their channels through data-driven content decisions. I have worked with creators across niches including tech, education, and lifestyle, and specialise in translating YouTube Analytics data into actionable growth strategies.
Categories: YouTube Analytics, YouTube Growth Tips