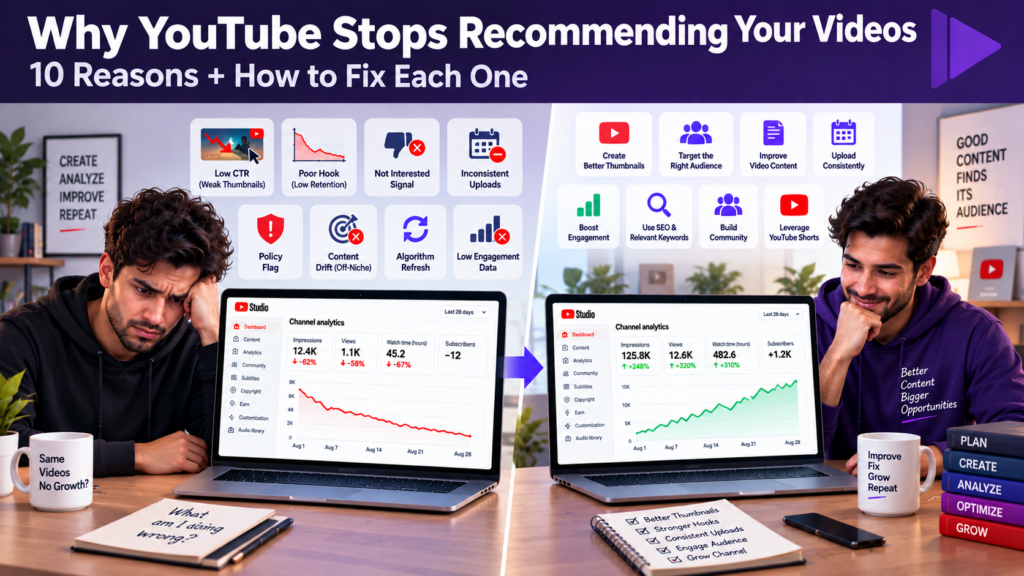
Why YouTube Stops Recommending Your Videos – 10 Real Reasons and How to Fix Each One
Posted on September 17, 2026 by Jason Caldwell
You open YouTube Studio and something looks wrong. Impressions are down. Views have dropped. The graph that was climbing a few weeks ago is now flat or falling. And nothing obvious has changed – you’re still uploading, the thumbnails look good, the topics are the same.
The frustrating part is that YouTube doesn’t send you an email explaining why it stopped recommending your videos. The data is in your analytics dashboard, but knowing which numbers to look at – and what they’re actually telling you – is what most creators get wrong.
This guide covers 10 specific reasons why YouTube stops recommending your videos, what each one looks like in YouTube Studio, whether it’s a temporary pause or a lasting problem, and the exact steps to fix each one. Not generic advice. Specific actions tied to specific signals.
Before You Fix Anything – Understand What YouTube Is Actually Doing
YouTube’s recommendation system doesn’t push videos arbitrarily. It runs a continuous test. Every new video gets shown to a small test audience first – typically your existing subscribers plus a group of viewers who match your channel’s established audience profile. YouTube then measures their response: did they click? Did they stay? Did they come back for more?
If those signals are strong, YouTube expands distribution – showing the video to larger audiences through Browse and Suggested Videos. If the signals are weak, it pulls back. The video gets fewer impressions. Views decline. It feels like YouTube stopped pushing your content. In reality, it’s responding exactly as designed to the data it received.
This matters before you start fixing anything, because there are two completely different situations that look identical from the outside.
Temporary Pauses vs Permanent Suppression
A temporary pause happens when YouTube is recalibrating its model for your channel – a normal process that happens every 6 to 8 weeks. Impressions drop for 5 to 10 days, then recover as the algorithm settles. Many creators panic during this window, change their thumbnails, switch topics, or post frantically – all of which make things worse by introducing new variables while the model is recalibrating.
Permanent suppression is different. It happens when your content has generated consistently poor engagement signals over multiple videos – low CTR, poor retention, audience rejection signals, or policy flags. The algorithm isn’t pausing. It’s made a decision based on accumulated data that your channel is not worth distributing widely right now.
The distinction is critical because the fix is completely different. A temporary pause needs patience and consistency. Permanent suppression needs specific changes to the content, the targeting, or the channel’s policy record. Doing the wrong fix for the wrong problem wastes weeks and makes recovery harder.
The way to tell them apart: open YouTube Studio, go to Analytics, and check the Impressions graph. A temporary pause shows a dip that begins recovering after 7 to 10 days. Permanent suppression shows a sustained downward trend across multiple consecutive videos with no recovery. The first is normal. The second needs action.
Reason 1: Your Click-Through Rate Dropped Below What YouTube Expects
CTR – the percentage of people who clicked your thumbnail after seeing it – is one of the two most important signals YouTube uses to decide how widely to distribute a video. If your recent videos are generating a lower CTR than your channel’s established average, YouTube interprets that as a signal that the content isn’t worth showing as widely.
The average CTR across YouTube sits between 2% and 10%, with most established channels landing between 4% and 6%. But YouTube doesn’t compare your CTR to other channels. It compares your recent CTR to your own channel’s historical average. A channel that consistently hit 6% and then drops to 3% on its last three videos will see impressions fall – not because 3% is bad in absolute terms, but because it’s a significant decline from what the algorithm learned to expect.
How to Check It
Go to YouTube Studio, click Analytics, then select the Content tab. Look at the CTR column for your last 10 videos. Find where the drop started – the specific video where CTR declined relative to your earlier videos. That video is your starting point. Compare its thumbnail and title to the ones that performed better. What’s different?
How to Fix It
Redesign the thumbnail on the underperforming video first. Don’t change the title at the same time – change one variable at a time so you can see what actually moved the needle. Strong thumbnails in 2026 share three characteristics: a clear focal point visible at small sizes, strong contrast between the subject and the background, and an emotional or curiosity element that creates a reason to click beyond just recognising the topic.
If your last three or more videos all have low CTR, the problem is likely a pattern rather than a single video issue. Review your thumbnail style and title structure as a whole. Sometimes a channel gradually drifts toward thumbnails that look too similar to each other – viewers stop noticing them because they blend together in the feed.
Reason 2: Your Audience Retention Dropped in Recent Videos
Watch time and audience retention are the second half of the equation. Even if your CTR is strong – people are clicking – YouTube also measures what happens after the click. A video that generates clicks but loses most of its viewers in the first 90 seconds sends a clear signal: the thumbnail and title promised something the video didn’t deliver.
In 2026, YouTube’s algorithm weights viewer satisfaction signals more heavily than raw watch time. A video that viewers finish, save, or rewatch generates stronger distribution signals than a video with high total watch time but poor completion rates. The algorithm is less interested in how long a video is and more interested in whether the viewer felt their time was well spent.
How to Check It
Go to YouTube Studio, click Analytics, click Content, then click on an individual video. Select the Audience Retention tab. Look at two things: the shape of the curve in the first 30 seconds, and any sudden steep drops in the middle of the video. The first 30 seconds tell you whether your hook is working. The mid-video drops tell you where pacing, relevance, or quality problems are appearing.
How to Fix It
If the drop happens in the first 30 seconds, the hook is the problem. Start your next video with the single most compelling moment – the thing that makes this video worth watching – within the first 15 seconds. Cut the intro sequence, the welcome back greeting, and the channel branding until after you’ve delivered your opening value. Viewers who get something immediately stay longer.
If the drops happen in the middle, find the exact timestamp in your retention graph and watch what’s happening at that moment in the video. It’s usually one of three things: a tangent that loses relevance, a pacing issue where the energy drops, or a section that could be cut by two minutes without losing anything important. Every minute of video that doesn’t add value costs you retention – and retention costs you distribution.
Reason 3: Viewers Are Clicking ‘Not Interested’ on Your Videos
This is the most damaging signal on this list – and the one most creators don’t know about. When a viewer sees your video in their feed and clicks the three-dot menu to select ‘Not interested’ or ‘Don’t recommend channel,’ YouTube logs that as an active rejection signal. It immediately stops showing your content to that viewer. More importantly, if enough viewers in a specific audience segment reject your content this way, YouTube removes your videos from recommendations for that entire audience segment – permanently, until you rebuild trust with different content.
You can’t see the raw ‘Not interested’ count in YouTube Studio. But you can see its effect. If your impressions are dropping while your CTR and retention are holding steady – meaning people who do see your videos are clicking and watching – the problem may be that YouTube is showing your videos to fewer people because certain audience segments have repeatedly rejected them.
What Causes It
The most common trigger is thumbnail or title mismatch – promising something the video doesn’t deliver. A viewer who clicks expecting one thing and finds another will click ‘Not interested’ and won’t come back. Misleading thumbnails don’t just fail on CTR. They actively damage future distribution by training a segment of the audience to reject your channel.
The second trigger is content that appears in the wrong audience’s feed. If your niche targeting has drifted or if a video performed well with an unintended audience, YouTube may serve future videos to that audience – who then reject them because the content doesn’t match their interests. This creates a negative feedback loop where rejection signals restrict your reach in audiences that were never right for your content in the first place.
How to Fix It
Audit your last 10 thumbnails and titles against the actual content of each video. Ask honestly: does this thumbnail accurately represent what a viewer will experience? If there’s a gap, close it. Accurate thumbnails that generate lower CTR outperform misleading thumbnails that generate higher CTR in the long run – because the viewers who click an accurate thumbnail are the right viewers, and they don’t reject you.
Reason 4: You Published a Video That Broke Your Topical Authority
YouTube’s algorithm builds a model of what your channel is about based on your content history. It learns your niche, your audience profile, and what types of viewers your videos attract. This topical authority is what allows YouTube to confidently recommend your videos to viewers who haven’t seen your channel before – because the algorithm knows who is likely to enjoy your content based on who has enjoyed it before.
When you publish a video that falls outside your established niche, two things happen. First, that video attracts a different audience – viewers who aren’t interested in your regular content. Second, their behaviour on your channel – lower retention, fewer subscriptions, potentially ‘Not interested’ signals – gets fed back into the algorithm’s model for your channel as a whole. One off-niche video can temporarily confuse the algorithm’s audience targeting for your entire channel, not just that specific video.
How to Check It
Look at your Traffic Sources breakdown in YouTube Studio for the underperforming video. Compare the demographic breakdown of viewers who came to that video against your channel’s typical audience profile. If the age range, geographic distribution, or interest categories look significantly different from your channel average, the video attracted the wrong audience – and their behaviour has affected your channel’s broader targeting.
How to Fix It
Don’t delete the off-niche video – that removes whatever positive engagement it generated and doesn’t reset the algorithm’s model. Instead, publish three or four strong videos firmly within your core niche in quick succession. This gives the algorithm fresh, consistent data that reinforces your channel’s established audience profile and dilutes the signal from the outlier video. Consistency over the following three to four weeks is what restores topical authority faster than anything else.
Reason 5: Your Upload Schedule Became Inconsistent
YouTube’s algorithm learns when your audience expects new content. If you’ve been uploading every Wednesday for three months and then go silent for five weeks, two things happen. Your existing subscribers form a new habit around other channels that filled the gap. And YouTube’s model for your channel – which had learned when to surface your content – loses confidence in your publishing pattern and reduces your baseline distribution.
Inconsistency doesn’t just cost you views on the videos you didn’t publish. It costs you distribution on the videos you do publish afterward, because the algorithm’s confidence in your channel’s reliability has decreased. The first video back after a long gap almost always underperforms – not because it’s lower quality, but because the channel’s momentum has dissipated.
How to Check It
Go to YouTube Studio and look at your upload history over the past 90 days. Count the weeks where you didn’t publish. Then look at your impressions graph – does the decline align with a period of reduced or erratic publishing? If the impressions started falling during or shortly after a gap in uploads, inconsistency is at least part of the cause.
How to Fix It
Resume a consistent schedule before you try anything else. One video per week, every week, is more valuable to algorithmic recovery than three videos in one week followed by another silence. The algorithm needs to re-learn that your channel is active and reliable before it restores your previous distribution levels.
If your current schedule isn’t sustainable, reduce the frequency rather than risking another gap. Every two weeks, reliably, outperforms weekly uploads with a 50% miss rate. Consistency of pattern matters more than frequency of output.
Reason 6: Your Videos Have a Policy or Advertiser-Friendliness Issue
YouTube limits the distribution of videos that contain content flagged as unsuitable for advertisers or as violating community guidelines – even when that content doesn’t result in a formal strike. A video marked as ‘Limited or no ads’ in YouTube Studio has been identified as less suitable for broad distribution, and in some cases, this limitation extends beyond that video to affect the channel’s overall recommendation reach.
The categories that most commonly trigger limited distribution include: excessive profanity, controversial political or social commentary without clear context, graphic imagery, and thumbnails that violate YouTube’s misleading content policy. It’s also worth noting that YouTube’s AI-generated content disclosure requirement, introduced in 2026, treats undisclosed AI-generated content as a potential policy concern that can affect distribution.
How to Check It
Go to YouTube Studio, click Content in the left sidebar, and look at the monetization status column for each video. Videos showing ‘Limited or no ads’ have been flagged. If several of your recent videos carry this label, the pattern is affecting your channel’s broader distribution – not just those individual videos.
How to Fix It
For each flagged video, click through to see the specific reason. Some flags can be removed by editing the video to remove the flagged content, changing a misleading thumbnail, or adding the required AI-generated content disclosure. Others reflect a genuine content decision – if the video covers a topic that is inherently limited, accept the restricted distribution and ensure your other videos don’t carry the same issue.
If you believe a flag was applied incorrectly, YouTube offers a request-review option for most content decisions. This is worth using when you’re confident the content doesn’t violate the cited policy – incorrect flags do get overturned, and a successful review removes the distribution limitation. The Why Is My YouTube Channel Not Monetized guide covers the policy landscape in more detail, including the specific flags that affect YPP review and channel-wide distribution.
Reason 7: Your Subscribers Are Not Watching Your New Videos
When you upload a new video, YouTube shows it first to your subscribers – specifically the portion of your subscriber base who have been active on the platform recently. The engagement from this initial subscriber audience is the first signal YouTube uses to decide how broadly to distribute the video beyond your existing base.
If your subscribers consistently don’t click your new videos – because they’ve become inactive, because the content has drifted from what they subscribed for, or because they’re not being notified – the first distribution test produces weak signals. YouTube interprets that as evidence that the video isn’t worth showing to non-subscribers either. The video never gets past the initial test audience.
The Subscriber Engagement Rate Problem
Channels where fewer than 10% of subscribers watch new videos within the first 48 hours consistently see significantly reduced Browse feature impressions compared to channels where 15 to 20% of subscribers engage quickly. Your subscriber base is not just your audience – it’s your distribution engine. A disengaged subscriber base is one of the most common hidden causes of declining reach.
How to Check It
Go to YouTube Studio, click Analytics, then Audience. Look at the Returning Viewers metric and its trend over time. A declining returning viewer count alongside a stable or growing subscriber count tells you that existing subscribers are becoming less engaged – they’re present in your numbers but absent in your viewing activity.
How to Fix It
Use the Community tab to post an update 24 hours before uploading a new video. Creators who post a community teaser before their upload report higher same-day view counts from subscribers – simply because more subscribers are aware that a new video is coming. Inside videos, end with a direct, specific reason to subscribe and turn on notifications. Not a generic ask – tell viewers exactly what they’ll get and when: ‘I post every Tuesday on topic X – if that’s useful to you, subscribe and hit the bell.’
Reason 8: You Changed Something That Was Working
This is one of the most common causes of sudden reach drops – and one of the most overlooked. When a channel’s content, thumbnail style, title format, or upload timing changes significantly, the algorithm’s model for that channel becomes temporarily less accurate. It has learned to predict who will watch your videos based on historical patterns. When those patterns change, the prediction confidence drops – and so does distribution.
The change doesn’t have to be dramatic. Shifting from landscape thumbnails to portrait thumbnails. Changing from question-based titles to statement-based titles. Moving from 10-minute to 20-minute videos. Any of these can disrupt the algorithm’s targeting model temporarily – not because the new approach is worse, but because the model needs time to learn the new pattern.
How to Check It
Think back to what changed in the period just before your impressions dropped. Look at your videos from 4 to 6 weeks before the decline and compare them to your videos in the decline period. What’s different? Thumbnail style, title structure, video length, topic angle, or upload day are the most common variables that shift without creators consciously noticing.
How to Fix It
If the change was intentional and you want to maintain it, give the algorithm 4 to 6 weeks of consistent new-pattern videos before evaluating whether the change is helping or hurting. The model needs enough data to recalibrate. If the change was accidental – you drifted without realising it – return to the style and format that was working and stay consistent for the same 4 to 6 week period.
Reason 9: The Algorithm Refresh Cycle – When the Drop Is Temporary
Not every impression drop has a specific cause you can fix. Every 6 to 8 weeks, YouTube’s recommendation algorithm runs a model refresh for individual channels. During this window – typically 5 to 10 days – impressions may drop across all your recent videos regardless of content quality. It’s a recalibration, not a judgment.
The critical mistake creators make during this period: they panic. They change thumbnails, switch topics, post extra videos, or make wholesale changes to their channel strategy – all while the model is in the middle of recalibrating. These changes introduce new variables that extend the recalibration period and can turn a 10-day dip into a 6-week recovery.
How to Tell If This Is What’s Happening
A genuine algorithm refresh looks like this in YouTube Studio: impressions drop across multiple videos simultaneously on the same day or within a 2-day window, CTR and retention remain at your channel’s normal levels on the videos that are still receiving impressions, and there’s no policy flag, no copyright issue, and no obvious change in your own upload behaviour that coincides with the drop.
The distinguishing feature is that everything except impressions looks normal. Your content is performing well – viewers who see it are clicking and watching – but fewer people are being shown it. That’s the signature of a model refresh rather than a content problem.
The Correct Response
Do nothing different. Keep uploading on your normal schedule. Don’t change thumbnails or titles on existing videos. Don’t increase upload frequency to compensate. Wait for 7 to 10 days and check whether impressions are recovering. They almost always do – provided you haven’t introduced new variables that confuse the recalibration process further.
Reason 10: Your Channel Has an Engagement Data Gap
Some channels have genuinely strong content – good hook, solid retention, consistent niche – but still struggle with algorithm distribution because the channel is too new or too small to have generated enough engagement data for YouTube to act on confidently. The algorithm needs a minimum threshold of data before it begins distributing content widely through Browse and Suggested Videos. Without that data, it distributes cautiously.
This situation looks like permanent suppression but isn’t caused by any of the problems above. CTR is fine. Retention is fine. Schedule is consistent. Niche is clear. But impressions remain low because the channel simply hasn’t generated enough watch time, engagement signals, and viewer history for the algorithm to trust it yet.
How to Identify This
Check your Traffic Sources breakdown in YouTube Studio. A channel in the engagement data gap gets most of its views from YouTube Search – people finding specific videos through search queries – with very little Browse or Suggested Video traffic. Browse traffic specifically requires algorithmic confidence in your channel’s audience profile. If Browse is contributing less than 20% of your total views, the algorithm hasn’t built enough confidence to distribute your content proactively.
How to Fix It
The organic path is time and consistency – continuing to publish strong content that generates real engagement signals until the accumulated data crosses the threshold where YouTube begins distributing proactively. For most channels in this position, that threshold is reached somewhere between 50 and 100 videos with consistently strong retention, or after significant watch time accumulation.
The faster path is injecting real engagement data through legitimate promotion. A targeted campaign run through Google Ads infrastructure puts your video in front of a real audience that matches your niche – viewers who generate real watch time, real retention signals, and real subscriber conversions. Those signals are recorded in YouTube’s system and feed directly into the algorithm’s confidence model for your channel. Creators who have used Vedzzy’s Google Ads-based promotion for exactly this purpose describe the effect accurately: the campaign delivers real viewers who generate real data, and the algorithm responds to that data by expanding organic distribution after the campaign ends. Every view appears in YouTube Studio under Traffic Sources as ‘YouTube advertising’ – independently verifiable, with full watch time and retention data attached. The YouTube Analytics Explained guide on Vedzzy covers exactly how to find and read this data in your own dashboard.
The condition that makes this work is content quality. Strong retention from promoted views signals to YouTube that the content deserves wider distribution. Weak retention from the same views signals the opposite. Promotion accelerates the data accumulation that the algorithm needs – it doesn’t substitute for content that holds viewer attention.
The 5-Minute Diagnosis – What to Check First in YouTube Studio
Before deciding which of the 10 reasons above applies to your channel, run this diagnosis in YouTube Studio. It takes 5 minutes and tells you which category of problem you’re dealing with.
| What You See in YouTube Studio | What It Means | Where to Start |
| Impressions down, CTR and retention normal | Algorithm refresh cycle OR engagement data gap | Wait 10 days. If no recovery, check Traffic Sources for Browse % |
| Impressions down AND CTR dropped | Thumbnail or title problem on recent videos | Redesign thumbnail on most recent 3 videos. One change at a time |
| Impressions down AND retention dropped in first 30 sec | Hook is failing – viewers leaving before 1 minute | Rewrite opening structure of next video. Lead with value immediately |
| Impressions down AND retention drops in mid-video | Pacing or relevance problem mid-video | Find exact timestamp of steepest drop. Watch that section. Cut or tighten it |
| Impressions down, CTR fine, retention fine, Browse % very low | Engagement data gap – not enough history for algorithm confidence | Consistent uploads for 8 weeks OR legitimate promotion to inject real data |
| Multiple videos showing Limited or No Ads | Policy flag affecting channel-wide distribution | Check Content tab for flags. Review and appeal each one. Fix flagged content |
| Subscriber count growing but returning viewers declining | Content drift – subscribers no longer interested in current topic | Compare top subscriber-generating videos to recent uploads. Return to that lane |
| Impressions drop coincides with upload gap | Schedule inconsistency broke algorithmic momentum | Resume consistent schedule. 4–6 weeks of regular publishing to restore momentum |
Use the first column to identify which pattern matches your situation, then follow the corresponding action. Most channels dealing with a recommendation drop are experiencing two or three of these problems simultaneously – a retention issue that triggered reduced distribution, combined with a thumbnail problem that compounded it. Fix them in the order shown: policy issues first, then CTR, then retention, then schedule.
How Long Recovery Actually Takes
One of the most important things to know before you start fixing anything is how long the fix takes to produce results. Every change you make to a video or your channel strategy goes through the algorithm’s re-evaluation cycle before impressions recover. Making changes and then panicking after 48 hours because nothing has moved is the fastest way to make things worse.
| Problem Fixed | Typical Recovery Time | What to Watch |
| Algorithm refresh cycle (no changes made) | 7 – 10 days | Impressions gradually returning to previous levels |
| Thumbnail redesigned on recent video | 3 – 7 days after change | CTR on the updated video climbing in YouTube Studio |
| Hook rewritten in next video | First 48 hours of new video’s performance | First 30-second retention improving vs previous video |
| Upload schedule resumed after gap | 3 – 5 weeks of consistent posting | Impressions per video gradually recovering week on week |
| Policy flag resolved or appealed | 5 – 14 days after resolution | Limited ads label removed, impressions on flagged video recovering |
| Niche refocused after content drift | 4 – 8 weeks of on-niche content | Returning viewer metric in Audience tab stabilising or growing |
| Engagement data gap filled via promotion | 5 – 14 days post-campaign | Browse traffic % increasing in Traffic Sources tab |
These timelines are realistic ranges, not guarantees. Channels with stronger engagement histories recover faster than newer channels with limited data. The one consistent pattern across all recovery scenarios: creators who make one change and give it enough time to produce data recover faster than creators who make multiple changes simultaneously and can’t identify what worked.
Frequently Asked Questions
Why did YouTube suddenly stop recommending my videos after they were doing well?
A sudden drop after a period of strong performance is almost always caused by one of three things: a recent video that underperformed relative to your channel’s established benchmarks, an upload gap that broke your channel’s momentum, or the normal algorithm refresh cycle that affects every channel every 6 to 8 weeks. Open YouTube Studio and look at your Impressions and CTR data for the last 10 videos. Find the specific video where impressions started declining – that’s your starting point. If CTR and retention are normal on that video but impressions dropped, the likely cause is either the refresh cycle or a non-obvious change in your content pattern.
How long does it take for YouTube to start recommending your videos again?
It depends on the cause. Algorithm refresh cycles typically self-correct within 7 to 10 days without any changes on your part. Thumbnail and title problems can recover within 3 to 7 days of being fixed. Schedule inconsistency takes 3 to 5 weeks of consistent posting to rebuild momentum. Niche drift takes 4 to 8 weeks of on-niche content before the algorithm restores your previous distribution confidence. Policy flags take 5 to 14 days after resolution. The key across all of these is making one change, giving it enough time to generate data, and then evaluating before making the next change.
Does posting more videos help when YouTube stops recommending your content?
It depends on why recommendations stopped. If the cause is a genuine content quality issue – poor retention, low CTR, or viewer rejection signals – posting more videos of the same quality compounds the problem by adding more data points that confirm the algorithm’s negative signal. If the cause is schedule inconsistency, posting consistently does help restore momentum. If the cause is the algorithm refresh cycle, posting extra videos during the recalibration window can actually extend the recovery period. Identify the cause before increasing output.
Can changing my thumbnail get YouTube to recommend my video again?
Yes, sometimes. If a video’s low impression count is being caused by poor CTR – people seeing the thumbnail and not clicking – then redesigning the thumbnail can improve CTR, which signals to YouTube that the video is worth distributing more broadly. However, if impressions are low because of poor retention rather than poor CTR, changing the thumbnail addresses the wrong problem. Check your CTR first. If it’s below your channel average, the thumbnail is a good place to start. If CTR is normal but retention is low, the problem is inside the video, not on the thumbnail.
Does deleting underperforming videos help with YouTube recommendations?
Generally no, and sometimes it makes things worse. Deleting a video removes whatever positive engagement signals it generated – watch time, likes, comments – from your channel’s total history. YouTube’s model for your channel becomes slightly less informed with every deletion. The better approach for genuinely underperforming videos is to set them to private (preserving the engagement data in YouTube’s records) rather than deleting them. The only strong case for deletion is a video that is actively generating ‘Not interested’ or ‘Don’t recommend channel’ signals – in which case removing the source of those negative signals may help. Even then, setting to private is preferable to permanent deletion.
Why do some of my videos suddenly get views again after weeks of nothing?
This happens because YouTube’s recommendation system continuously re-evaluates archived content against new viewer behaviour patterns. A video that underperformed when it was first published may start receiving recommendations weeks or months later because: a related trending topic brought new searchers who engaged strongly with your video, the algorithm refreshed its model for your channel and reassigned the video to a different audience segment, or search traffic increased as the video’s topic became more relevant. This is why deleting old videos is almost never the right decision – YouTube may rediscover and recommend them at any point.
Does YouTube stop recommending your videos if you don’t reply to comments?
Not directly. YouTube’s algorithm doesn’t measure comment reply rate as a distribution signal. However, comment engagement – the total volume of comments a video receives in its first 48 hours – is one of several signals YouTube uses to assess whether a video is generating conversation and interest. Creators who reply to comments in the first 48 hours tend to see more comments overall, because replies encourage further engagement from other viewers. More comments equals a stronger engagement signal. The indirect effect on distribution is real, even though the direct causal link is to total comment volume rather than to whether the creator specifically replied.
Can paid promotion help restore YouTube recommendations?
Yes, when the root cause is an engagement data gap rather than a content quality problem. Channels with strong content that have limited algorithmic distribution because they lack watch history often benefit from legitimate YouTube advertising – campaigns run through Google Ads that deliver real views from real viewers, generating real watch time and retention data. That data feeds directly into the algorithm’s model for your channel and can trigger broader organic distribution after the campaign ends. The critical requirement is that the content needs to generate solid audience retention from the promoted viewers – typically 35% or higher average view duration – for the engagement signals to be positive enough to expand distribution.
How do I know if YouTube has suppressed my channel vs just one video?
Check your Impressions data across your last 10 to 15 videos in YouTube Studio’s Analytics tab. If impressions dropped on a single video while your other recent videos maintained their normal levels, the suppression is video-specific – likely caused by that video’s own CTR or retention performance. If impressions dropped across all your recent videos simultaneously around the same date, the suppression is channel-level – caused by an algorithm refresh, a policy flag, or a significant change in your channel’s engagement pattern. The channel-level drop is the more serious situation and requires addressing the underlying cause rather than just fixing individual videos.

Hi, I am Jason, a digital content strategist with 8 years of experience helping YouTube creators and brands grow their channels through data-driven content decisions. I have worked with creators across niches including tech, education, and lifestyle, and specialise in translating YouTube Analytics data into actionable growth strategies.
Categories: YouTube, YouTube Growth Tips